ABSTRACT
One hundred crowdsourced samples from municipal water supplies were acquired and tested via ICP-MS for concentrations of Al, Cu, As, Cd, Hg and Pb. Analysis was conducted via ICP-MS using an element-expanded variant of EPA methodology 200.8.[1] Resulting data reveal some samples exceeded current EPA limits for elements in public water. All samples showed zero detectable Hg. The data show that over 90 per cent of municipal water samples collected for this analysis were within EPA standards for toxic elements. This analysis did not test water for fluoride, pesticides or organic compounds.
INTRODUCTION
Concerned by the 2016 revelations of excessive Pb in the municipal water supply of Flint, Michigan, this author launched EPAwatch.org and announced a nationwide call for water samples from municipal water supplies from across the United States. This effort was part of a non-profit public interest program to document the concentration of toxic elements in public water systems.[2] Over the subsequent weeks, hundreds of water samples were collected by the public and sent to the Consumer Wellness Center Laboratories for analysis.
In order to confirm the water samples' origins, CWC Labs instituted a rigorous sample verification process. Sample origin and collection forms are kept on file at CWC Labs and include the date of the sample, zip code, name of the individual taking the sample and their contact information (phone number and email).
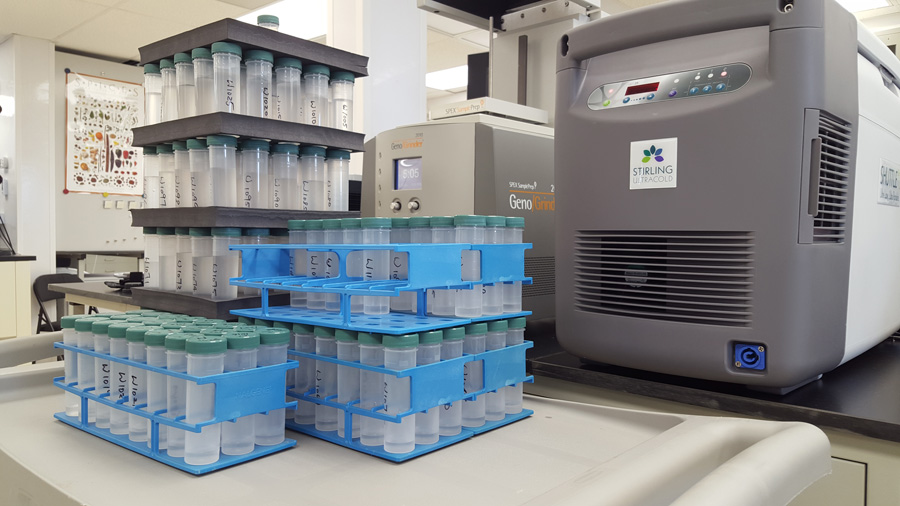
Most samples were submitted to CWC Labs using recommended 50mL polycarbonate vials. The first 100 samples accepted by the CWC Labs verification process were selected for this study.
All water samples were screened using pH strips, then checked for harmful radiation using a hand-held radiation meter. Additional steps, which shall be kept private for security reasons, were taken to assure the safety of CWC Labs personnel. No abnormal radiation was detected in the samples, and no pH results were outside expected ranges for municipal water. All samples were visually inspected, and none showed particulate matter, discoloration or other signs that might indicate tampering or attempted crowdsourcing hoaxes.
Volumes of received samples ranged from approximately 10mL to 100mL. Approximately 90 per cent samples were in the 40 - 50mL range. All original water samples have been archived for future analysis or verification.
METHODOLOGY
Five (5.0) mL of each water sample was volumetrically transferred into a 50 mL digestion vial using a calibrated pipette. All samples were visually determined to have turbidity well below 1 NTU. As described in EPA method 200.8 under "direct analysis," each water sample was stabilized and diluted by adding 45 mL of a diluent consisting of 3% HNO3 and 0.5% HCl.
Once diluted to 50 mL, samples were loaded into an Agilent ASX-500 Series autosampler in preparation for ICP-MS analysis. The ICP-MS instrument used was an Agilent 7700X, running in He mode with the following tune parameters:
RF Power = 1550
RF Matching = 1.70
Sample Depth = 9.0
Carrier Gas = 1.03 L/min
Option Gas = 0.0
Nebulizer Pump = 0.10 rps
S/C Temp = 2C
Gas Switch = Makeup gas
Makeup Gas = 0.0
He Gas Flow = 3.50 mL/min
Coolant Water Flow = 1.35 L/min
OctP Bias = -18.0
OctP RF = 200
Energy Discrimination = 4.0
QP Bias = -14.0
The ICP-MS analysis was initiated with a five-point external standards calibration curve. All analytes except Hg were calibrated on a concentration curve as follows:
Level 0: 0 ppb
Level 1: 4.8 ppb
Level 2: 24 ppb
Level 3: 120 ppb
Level 4: 600 ppb
Level 5: 3000 ppb
The resulting calibration curve correlation coefficient was calculated by Agilent MassHunter software to be 1.0000.
External Hg calibration curve concentrations were set as follows:
Level 0: 0 ppb
Level 6: 0.8 ppb
Level 7: 4.8 ppb
Level 8: 24 ppb
Level 9: 120 ppb
Level 10: 600 ppb
The detection limit (LOD) for Hg was calculated by the MassHunter software to be 0.03 ppb. The correlation coefficient of the calibration curve for Hg was calculated by the Mass Hunter software to be 1.0000.


Prior to the analysis of samples, a "blank" vial of the dilution solution was first analyzed and categorized as a Full Quant Blank to subtract its elemental composition from the final results. Analyte Counts Per Second (CPS) were extremely low across all scanned elements due to the laboratory grade DI water used in the dilution solution. This lab notes that very small concentrations of Al are typically found in HNO3, and very small concentrations of As are found in the HCl. These were all subtracted from final results.
During the ICP-MS run, multi-element calibration checks were conducted after every 10th unknown sample. Each calibration check showed all elements to be within acceptable ranges of accuracy. No element "drift" was detected.
Analyte data acquisition was carefully monitored during the run to watch for polyatomic interferences. Due to the addition of a small volume of HCl to the dilution solution, possible interferes at +35 and +37 were specifically monitored. No such interferences were detected.
The ICP-MS analysis was completed and data were recorded in the MassHunter software and archived for study.


RESULTS
Click here to view the expanded results - 05/09/2017 (364 samples)
Click here to view the expanded results - 06/20/2016 (239 samples)
DISCUSSION
EPA regulatory limits for toxic elements in potable water are as follows: [3]
As = 10 ppb
Cd = 5 ppb
Cu = 1300 ppb ("Action Level" designation by EPA)
Hg (inorganic) = 2 ppb
Pb = 15 ppb ("Action Level" designation by EPA)
The EPA notes on its "Table of Regulated Drinking Water Contaminants" [2] that excessive concentrations of toxic elements can cause serious damage to humans:
- Arsenic has been shown to cause "Skin damage or problems with circulatory systems, and may have increased risk of getting cancer"
- Cadmium has been linked to "kidney damage"
- Copper: "Short term exposure to Copper has been shown as a possible cause of gastrointestinal distress; Long term exposure to Copper has been linked to "Liver or kidney damage"
- Lead poisoning in Infants and children has been shown to cause "Delays in physical or mental development; children could show slight deficits in attention span and learning abilities." In adults lead poisoning has been linked to kidney problems and/or high blood pressure."
- High Mercury concentrations in drinking water can lead to "kidney damage"
For the purpose of reporting results, Pb 208 is cited here, although three isotopes of Pb were acquired during analysis (206, 207, 208). Hg was scanned at 200, 201 and 202. All samples showed zero results across all three mercury isotopes. Cd was scanned at 111 and 114.
ALUMINUM RESULTS
The EPA does not consider Al to be a contaminant of concern in municipal water systems. However, because high Al may be indicative of poor overall water quality or industrial contaminants, we include the two highest Al results from this group as areas that may merit further study:
Zip code 90066: 198.40 ppb
Zip code 92656: 130.95 ppb
COPPER RESULTS
All water samples analyzed were below the EPA limit of 1300 parts per billion (ppb).
The EPA limit for Cu in drinking water is 1300 ppb. Two samples were detected that exceed 90% of that limit, but do not exceed it:
Zip code 51025: 1241.24 ppb
Zip code 62226: 1175.40 ppb
One additional sample was found at 50% of the EPA concentration limit for Cu:
Zip code 62225: 649.70 ppb
ARSENIC RESULTS
The EPA limit for As in municipal water is 10 ppb. The three highest concentration samples found in this data set are shown below. None of the analyzed samples exceeded the current EPA limit of 10 ppb.
Zip code 90066: 4.63 ppb
Zip code 95066: 4.91 ppb
Zip code 68862: 6.06 ppb
CADMIUM RESULTS
The EPA limit for Cd in municipal water is 5 ppb. All 100 samples exhibited Cd concentrations well within the EPA limit.
MERCURY RESULTS
The EPA limit for inorganic Hg in municipal water is 2 ppb. All 100 samples showed 0.00 ppb for all three of the scanned isotopes of Hg (200, 201, 202). No mercury speciation was conducted.
LEAD RESULTS
The EPA limit for Pb in municipal water is 15 ppb. Two of the 100 samples exhibited Pb concentrations that exceed the EPA limit. One sample, from zip code 85086 (North of Phoenix, AZ) measured 120.60 ppb of lead, exceeding the EPA limit of lead in water by 700%.
Another sample from zip code 94566 (Pleasanton, CA) revealed lead at 16.03 ppb, slightly exceeding EPA limits.
One additional sample showed Pb exceeding 50% of the EPA's Pb limit:
Zip code 90066: 8.12 ppb
SUMMARY AND CONCLUSION
One hundred drinking water samples from municipal water supplies around the United States were analyzed for toxic heavy metal contamination. All but two of the 100 potable water samples exhibited toxic heavy metal concentrations below EPA limits. One sample from the Phoenix, AZ area and one from the Pleasanton, CA area exceeded the EPA limit for Lead. These households have been notified of the test results of their water samples.
FURTHER STUDY
The Consumer Wellness Center Laboratories (CWClabs.com) will continue to study the concentrations of heavy metals in potable water around the United States. As more data become available this paper will be updated.
REFERENCES
[1] https://www.epa.gov/sites/production/files... (PDF)
[2] http://epawatch.org/2016-03-10-health-ranger...
[3] https://www.epa.gov/your-drinking-water...
ACKNOWLEDGEMENTS
The author wishes to acknowledge Agilent for its robust analytical instrumentation that made this study possible.
ADDITIONAL INFORMATION
The author has no financial ties to the EPA or government funding sources. This study was funded by the non-profit Consumer Wellness Center (ConsumerWellness.org), where the author serves as the executive director in an unpaid position. The author donated his time to conduct this analysis in the public interest.